| Symbol Library Documentation |
Mostly, this whole page is for me. I created it to keep track of the symbols that I have created. I embedded it in my web site to keep it's access simple. Of course, anyone who might be interested, is welcome to give it a read.
The following information documents a symbol drawing function library. The library contains symbols that use the jsDraw2D.js 2-Dimensional Javascript drawing library. The jsDraw2D.js library provides all of the primitive functions, like lines, circles, squares, etc., for 2-dimensional drawing.
jsDraw2D.js is a pure JavaScript library to draw 2D graphics on web pages inside web browser without using SVG, VML or Canvas. JavaScript developers, web developers and webmasters can take advantage of the library to add graphics drawing functionality to their web applications or websites using the library. The library is entirely written in JavaScript and does not need any plug-in or additional software to run/execute. It works even on not-so-smart small screen mobile browsers too.
jsDraw2D.js is a JavaScript library to draw 2-Dimensional graphics on web pages inside web browser. The library is entirely written in JavaScript and does not need any plug-in or additional software to run/execute. The JavaScript source code of the library is open and free under "Creative Commons 3.0 Unported" license. The jsDraw2D documentation describes the various JavaScript classes along with their methods (APIs) available in the jsDraw2D library.
The menu on the left connects you with what I call Test Benches. It is important to have a place for exhaustivly testing a symbol, before it is included in a drawing. The Test Bench provides me with a way testing all of the parameters that a symbol might have. Some of the Test Benches only handle a single symbol. However, where parameters are common, some Test Benches handle multiple symbols.
The block diagram, below, is drawn the way it is, to show that the Symbol Library (JS) is the center of all operations. On the right, is the Test Bench processes (HTML & JS) and on the left, is the Drawing processes (HTML & JS). Below the block diagram is a brief explanation of each block, starting from left to right.
Drawing (HTML & JS) - To create a drawing in a HTML web page, you first need a container. For my purposes, the container consists of a <div id=""></div> structure. To allow for multiple drawing on a HTML page, each of these containers must have a unique "id". The container also needs some style definitions for setting the default width and height, borders, and spacings from other objects on the HTML page.
The ordering of tasks is important. You can see, in the block diagram, the HTML file must source (read) all required Javascript (JS), that will be performing the drawings. Depending on the page, some of the Javascript might be used to read and write data to the web page. Then the CSS (formatting/styling) files, which manage formatting of the HTML page and the drawing, are sourced. All of this happens in the <head></head> section of the HTML page.
Following the <head></head> section is a <body></body> section. The <body></body> section contains all of the HTML for a page. Initially, in the <body> tag, a "OnLoad" event is declared. This event tells the web browser that, after all of the HTML is read and rendered on the screen, there are several Javascript functions that need to be executed. On my pages, this usually includes the side menu script and a initialization function. The initialization function is used to run the rest of the Javascript.
Text Bench (HTML & JS) - Each symbol has display options. These options might be rotation, annotations (value label, reference designator), and even the ability to relocate those annotations. So it's important to have a way of testing every feature that a symbol may require. That is what the Test Bench is for, and why the Test Bench seems to be more complicated than just a drawing.
The Test Bench HTML and JS files work together. The Test Bench HTML starts out exactly like the Drawing HTML, in that, it sources all of the Javascript it will need and sets up a OnLoad event. After that, the Test Bench HTML file must set up form elements( e.g. selectors, buttons, and text input/output areas). These form elements are read, and sometimes rewritten, by the Test Bench JS file. With some selections the Javascript file might rewrite the HTML form elements, based on the particular symbol selected.
The Test Bench HTML must then create a sample display area, where the test symbol is displayed, and a text area, where the required Javascript code is displayed. The display area is only big enough to display one symbol. It displays the symbol according to the selection made for that symbol. This display area also allows for adding a background grid (10×10 pixels), a center line marker, and a pin ID. These are used when the symbol is being initially created and when options are added to a symbol.
The text area will display Javascript code that can be copy/pasted directly into a drawing Javascript. The only thing that has to be adjusted is the drawing object and the X/Y coordinates. This makes creating a drawing, much easier.
I have delt with graphic symbol creation, for schematic purposes, for over 30 years. During that time I have learned that there needs to be some standard that drive the symbol creation. Otherwise the schematics that are drawn would start to look odd. Some of the standards are listed below.
- Logic Devices
- Except for some special circumstances (e.g. 1488, 1489), all logic flows from left to right. Logic gates will not be rotatable.
- Logic gates will have DeMorgan equivalents.
- All devices will be marked with a Reference Designator, Part Name, and Pin Numbers. The Pin Numbers will be for the Dual Inline Package.
- Multi-section devices, like gate packages, will be marked with a section ID, after the Reference Designator. There is no guarantee that my section IDs will match those used in some one elses schematics.
- Larger logic devices, like counters and decoders, may have horizontal and vertical versions.
- Logic devices, like flip-flops, will have internal markings indicating a pin's function. Clock inputs will contain a Up Arrow or Down Arrow, depending on it's triggering. Master/Slave Clock inputs will be marked with a Square Wave symbol. A positive Square Wave indicates the transfer of data to the Master on the rising. And transfer of data to the Slave on the falling edge.
- Drawing coordinates specified in the logic instance will be the center of the device.
- Coordinates for all input and output will be returned in an array. Ordering of those return coordinates are detailed in the Test Bench sample.
- Discrete Devices (Resistors, Capacitors, etc..)
- Standard electronic symbols will be used.
- Semi-Conductors (Transistors, Diodes, etc..)
- Flow Chart
- Symbols consist of boxes, triangle, diamond, and circle shapes that can include internal annotations.
- Each Flow Chart symbol will return coordinated of it's input and output. These are often the middle of horizontal/vertical line segments, for boxes, and end points for triangle, diamond shapes. End points for circles may vary.
| Drawing Creation |
The list below describes the steps needed to add a drawing to a web page. This is mostly for my own purposes, so that I don't forget something, when I create a new document. The descriptions may not be very detailed, but it's all I need. I can cut/paste directly from this document to drawings started on my web pages.
Source the JavaScript Code
Before you can draw anything, you need to source the JavaScript functions. Add following code inside the <head>...</head> structure of your HTML document. The first instance is the jsDraw2D JavaScript code (jsDraw2D.js). The other instances are my various JavaScript drawing libraries. The libraries are split into groups so that you only have to include the groups you require, for any particular drawing. Each of the groups below has a link to a separate HTML page. That page contains the test benchs for that group of symbols. Each test bench details the calling sequence and options, for a particular symbol.
The last file, my_drawing.js is your drawing file that contains your JavaScript commands. If there is a library that you don't need, comment it out. This will eliminate a lot of overhead required for some of the libraries.
<link rel="shortcut icon" href="favicon.ico" />
<!-- Load the Main -Program. Adjust the name of page below. -->
<script type="text/JavaScript" language="JavaScript" src="./js/js_Generics.js" ></script>
<script type="text/JavaScript" language="JavaScript" src="./js/Mobile_Menu.js" ></script>
<!-- Load the Drawing Libraries -->
<script type="text/JavaScript" language="JavaScript" src="./js_Symbols/jsDraw2D.js"></script>
<script type="text/JavaScript" language="JavaScript" src="./js_Symbols/Pens_And_Colors.js"></script>
<script type="text/JavaScript" language="JavaScript" src="./js_Symbols/Generics.js"></script>
<script type="text/JavaScript" language="JavaScript" src="./js_Symbols/Border_And_Label.js"></script>
<script type="text/JavaScript" language="JavaScript" src="./js_Symbols/Wiring.js"></script>
<script type="text/JavaScript" language="JavaScript" src="./js_Symbols/Connectors.js"></script>
<script type="text/JavaScript" language="JavaScript" src="./js_Symbols/Switches.js"></script>
<script type="text/JavaScript" language="JavaScript" src="./js_Symbols/RLC_Parts.js"></script>
<script type="text/JavaScript" language="JavaScript" src="./js_Symbols/Semi_Cond.js"></script>
<script type="text/JavaScript" language="JavaScript" src="./js_Symbols/Logic_Misc.js"></script>
<script type="text/JavaScript" language="JavaScript" src="./js_Symbols/Logic_CMOS.js"></script>
<script type="text/JavaScript" language="JavaScript" src="./js_Symbols/Logic_TTL.js"></script>
<script type="text/JavaScript" language="JavaScript" src="./js_Symbols/Analog_Devs.js"></script>
<script type="text/JavaScript" language="JavaScript" src="./js_Symbols/Micro.js"></script>
<script type="text/JavaScript" language="JavaScript" src="./js_Symbols/Flow_Chart.js"></script>
<script type="text/JavaScript" language="JavaScript" src="./js/my_drawing.js" ></script>
<!-- Source the Javascript libraries -->
<script type="text/javascript" language="JavaScript" src="./js/lib_m.js"></script>
<script type="text/javascript" language="JavaScript" src="./js/lib_e.js"></script>
<!-- Load the style sheets -->
<link rel="stylesheet" type="text/css" href="./css/master_styles.css"></script>
<link rel="stylesheet" type="text/css" href="./css/Multi_Level.css"></script>
<link rel="stylesheet" type="text/css" href="./css/Drawing.css"></script>
<!-- Load the style sheet specific to this page -->
<!-- <link rel="stylesheet" type="text/css" href="./css/[name].css" /> -->
Instantiate the drawing "<div>"
My drawings mostly consist of shapes, lines, and text that can be created using the jsDraw2D.js. That library uses a <canvas> structure because that is what they use in the jsDraw2D.js example. However, I don't require the interactive capabilities of a canvas or svg structure. So I use a div structure
The HTML code below is how the drawing <div> is instantiated in a HTML document. The "id" must be unique to all other structures that use a "id". The "class" defines the style setting to associate with the drawing. In this first case, I use the CSS setting for a "B-Size" drawing, Centered on the HTML page.
In this next case, I use the B-Size class to initiate the the drawing, but then override it with a specific size. I also specify the drawing to be float right and have the text wrap on the left. This is useful when you have small drawing to embed.
You can also use a float left and have the text wrap on the right. This sample is the same as the one above, but includes a green 1 pixel boarder. The boarder definition can be turned on/off by simply changing the pixel specification, 1px, to 0px.
Drawing CSS
| Engineering Drawing Sizes | |||
|---|---|---|---|
| ANSI Size | Dimensions | Dimensions | L/W Ratio |
| A | 8.5" × 11" | 215.9mm x 279.4mm | 1.3:1 |
| B | 11" × 17" | 279.4mm x 431.82mm | 1.5:1 |
| C | 17" × 22" | 431.8mm x 558.8mm | 1.3:1 |
| D | 22" × 34" | 558.8mm x 863.6mm | 1.5:1 |
| E | 34" × 44" | 863.6mm x 1117.6mm | 1.3:1 |
Drawing CSS - The CSS code below is an example of the style settings that can be used with the drawing <div> above. The A-Size and B-Size designation are really arbitrary. But they are the same Length/Width ratios as the standard A-Size and B-Size drawings. A-Size, C-Size, and E-Size drawings had 1.3:1 Length/Width ratios. B-Size and D-Size drawings had 1.5:1 Length/Width ratios. A-Size drawings often came in portrait and landscape orientations. A-Size Portrait was 8-1/2" Wide x 11" High and A-Size Landscape was 11" Wide x 8-1/2" High. Either one fit easily into a binder.
There is no requirement to stick to standard sizes for your drawings. Drawings can be any size you like. The last two styles below show style settings for smaller drawings than the first there. Generally, I start with a small drawing and start working from the bottom left, and then up and across the drawing. If I need more space I can increase the drawing size without moving everything on the drawing.
Note: The B-Size style, defined below, is probably the biggest drawing you may want on your web page. That size can fit on a single screen, without browser and OS headers/footers getting in the way. Anything bigger may cause the screen to generate scroll bars.
<!-- /* 1:1.3 Ratio - portrait A */
.A-Size_Port { overflow:hidden; position:relative; width:600px; height:780px;
border:1px solid #3f7f00; margin-left:auto; margin-right:auto; margin-bottom:10px; }
/* 1.3:1 Ratio - landscape A, C, E */
.A-Size_Land { overflow:hidden; position:relative; width:780px; height:600px;;
border:1px solid #3f7f00; margin-left:auto; margin-right:auto; margin-bottom:10px; }
/* 1.5:1 Ratio - landscape B, D */
.B-Size { overflow:hidden; position:relative; width:900px; height:600px;
border:1px solid #3f7f00; margin-left:auto; margin-right:auto; margin-bottom:10px; }
/* 350 x 250 drawing */
.DWG_350x250 { overflow:hidden; position:relative; width:350px; height:250px;
background-color:#C6F7BD; border:1px solid #3f7f00; box-shadow: 5px 5px 5px #888888;}
/* 450 x 250 drawing */
.DWG_450x250 { overflow:hidden; position:relative; width:450px; height:250px;
background-color:#C6F7BD; border:1px solid #3f7f00; box-shadow: 5px 5px 5px #888888;}
--> </style>
Create a JavaScript Drawing Function
I keep all of my JavaScript file in a folder named "js". That is why all of the JavaScript references have "js/" as a prefix. A Javascript file, much like a HTML file, is nothing more than a text file with a ".js" extension. So you can easily create a empty text file and then change the extension to ".js". The OS will complain a bit, but just tell it to do it anyway.
The JavaScript file will contain all of your drawing commands grouped as a function. The function contains the initialization of the object followed by a series of function references to draw the diagram. In the code below, the red text is the id of the drawing <div>. This is then used to create the drawing object pointer, Drawing_Obj. I call it Drawing_Obj on this page, but the object name can be almost anything.
Note: the line numbers in the example are there for reference purposes only. Do not include them in your JavaScript functions.
2 var Drawing_Obj = new jsGraphics(document.getElementById("Sample_Schematic"));
3 var Height = document.getElementById("Sample_Schematic").clientHeight;
4 var Width = document.getElementById("Sample_Schematic").clientWidth;
5 var Drawing_Obj_X_Origin = 0, Drawing_Obj_Y_Origin = Height;
6 Drawing_Obj.setOrigin(new jsPoint( Drawing_Obj_X_Origin, Drawing_Obj_Y_Origin ));
7 Drawing_Obj.setCoordinateSystem("cartecian");
8 Drawing_Obj.setScale(1);
9 // Enable/disable drawing grid
10 Show_Grid( Drawing_Obj, "Off", Width, Height );
11
12 { Drawing function references }
13
14 }
Below is a line-by-line description of the code snippet above.
| Line | Description |
|---|---|
| 1 | This is just the standard function declaration. Each drawing should have a separate function. |
| 2 | Creates a drawing object pointer to your object window. Each drawing object should have a different id. |
| 3 | Extracts the Height of the object window. |
| 4 | Extracts the Width of the object window. |
| 5 | Defines the origin variables (Drawing_Obj_X_Origin and Drawing_Obj_Y_Origin) and allow for an offset that can be used to move the whole drawing. Negative values, added to the Y Origin, will move the entire drawing up. Positive values, added to the X Origin, will move the entire drawing to the right. By default, the drawing origin is set to the upper left of the drawing window. This then forces you to use negative values for Y. However, setting the Y Origin to Height changes the drawing origin to the lower left and allows the use of positive Y values. |
| 6 | Sets the origin for jsDraw2D, based on the defined origins. |
| 7 | Sets the coordinate System for jsDraw2D to "Cartesian". |
| 8 | Sets the scaling for jsDraw2D to 1. By default the scale value 1. Scale is the factor by which all the metric drawing parameters are converted before drawing the actual pixels. |
| 9, 10 | This function call is used to display a background grid by passing the string "On". The grid will have a vertical and horizontal line every 10 pixels. The line that is on a 100, 200, etc. boundry is darker than the others. This is for easily placing objects on the drawing. Displays the grid as per the 2D coordinate system. The setting of "20" display a 20 pixel grid on the drawing window. I use this line in conjunction with line 10, when I am initially creating a drawing. I enable this line and disable line 10 (with comment marks), so that I can see the reference grid. When I am mostly done, I disable line 9 and reenable line 10. | 13... | This is the main body of the drawing. |
- Onload - If you only have a single drawing on your page, you can simply include
the function reference in the <body> tag. The
example below shows a call to the drawing.
<body onload="Sample_Schematic();">
- Multiple Drawings - However, if you have multiple drawings on a web page it is
often easier to create a initialization function at the top of your JavaScript that
calls each drawing. Then the <body> tag only
needs a single reference to initialize all of the drawings.
HTML Document
<body onload="Init_Drawings();">JavaScript Documentfunction Init_Drawings() {
Sample_Schematic_1();
Sample_Schematic_2();
Sample_Schematic_3();
}
Add draw commands to the Javascript Code
Color Settings (Javascript) - The following global variables are defined in the function library. It they are not changed, the entire drawing will be done with black symbols, wires, dots, and text.
// Set the default drawing, fill, and text colors.
var Symbol_Pen = new jsPen(new jsColor("black"),1);
var Label_Color = new jsColor("black");
var Value_Color = new jsColor("black");
var Wire_Pen = new jsPen(new jsColor("black"),1);
var Dot_Fill = new jsColor("green");
If you wish to change the coloring the same global variables can be declared in your schematic drawing code. Below is and example that is used in this document. It changes the Symbol_Pen to "red", the Wire_Pen to "green", the Dot_Fill color to "green", and the Value_Color to "blue".
var Symbol_Pen = new jsPen(new jsColor("red"),1);
var Label_Color = new jsColor("black");
var Value_Color = new jsColor("blue");
var Wire_Pen = new jsPen(new jsColor("green"),1);
var Dot_Fill = new jsColor("green");
| Engineering Drawing Sizes | |||
|---|---|---|---|
| ANSI Size | Dimensions | Dimensions | L/W Ratio |
| A | 8.5" × 11" | 215.9mm x 279.4mm | 1.3:1 |
| B | 11" × 17" | 279.4mm x 431.82mm | 1.5:1 |
| C | 17" × 22" | 431.8mm x 558.8mm | 1.3:1 |
| D | 22" × 34" | 558.8mm x 863.6mm | 1.5:1 |
| E | 34" × 44" | 863.6mm x 1117.6mm | 1.3:1 |
Drawing Boarder and Label: Unlike the other entries on this page, this entry describes two draw functions: Drawing_Boarder(...) and Drawing_Label(...). If you are creating a drawing and need a border and label, these functions should be called first, followed by the rest of the drawing operations. The chart on the right shows typical drawing sizes. But these were sheets of vellum or drawing paper and were spread out on large drafting tables. Some of these sizes are still in use, but even 20 years ago, we were taking D-Size drawings and shrinking them to B-Size. That size was easier to handle and could be printed easily.
The B-Size designation, on the sample drawing, is really arbitrary. But it is the same Length/Width ratio (1.5:1) of the B-Size and D-Size, landscape, drawings. It was common to use the A-Size, portrait, drawings for small schematics because they fit right into a 8-1/2" x 11" binder. The A-Size has a 1.3:1 Length/Width ratio.
The Sample Schematic, shown at the bottom of this section, is 900 pixels wide by 600 pixels high (1.5:1 Ratio). This is about as big as you want to get, and still fit the whole drawing on one screen. My monitor is 1366 pixels wide x 768 pixels high. The browser's header and the operating system's task bar take up some vertical space, so 600 pixels high is about all you can do. On some systems, this may need to be reuced. If you do reduce it, also reduce the width keeping the 1.5:1 width/height ratio.
| Adding a Symbol to the Logic Library |
Adding a symbol to the logic library is a relatively complex operation. So this section is not only for those who are interested in my method of drawing. It is also for me. I don't always remember all the steps necessary to add a symbol. So this makes sure I cover all the necessary areas. I am actually writing this as I am adding some symbols.
The symbol library is driven by the requirements for logic symbol generation. Each time you add a symbol, you are not just adding a picture. Each logic symbol is a dynamic drawing with pin numbers, device name, and lable added, based on selections made when calling the symbol. When a symbol is being drawn, the symbol options must be deciphered. Normally, these options are passed to the symbol library from the instantiation in the drawing script. What complicates the symbol even more is that the X and Y coordinates of each symbol pin are returned from the symbol instantiation. This is an aid when wiring from symbol to symbol.
Often, adding a symbol is quick and easy, if the symbol already matches and existing symbol. For example, a SN7400 and a CD4011 are both Quad 2-Input NAND Gate packages. They may be different technologies, and their pin numbers may differ, but the basic symbol is the same. You then only have to account for different pin numbers.
Line numbers in the Javascript and HTML code will not be listed because, the line numbers continue to change as you add symbols.
Below are the three files that need to be modified, when adding a logic device. They are listed in the order that they should be modified.
- Logic.js - This is the file that is linked to, in any HTML
file that requires a schematic diagram. The other two files below, are support files for
testing and verifying any logic symbol created.
- Add a Logic Device Array. At the beginning of the Javascript file are the Logic Device Arrays. Every logic symbol requires one of these arrays. Associated with each array is a comment that describes the content of the array. The ordering of the array elements is important. The array starts with Device Name. Each Device Name is prefixed with "U", e.g U7400. The "U" is arbitrary and is only used because variable names that start with numbers are not allowed. This is followed by the numeric Type. That is followed by the "Number Of Pins". This is important because it defines the next series of array elements. Overall, each array can only have "Number Of Pins", plus 3, entries.
- Adjust the function "Make_Part_Name". This function takes care of adding a prefix to the beginning of a symbol name. I the symbol being added is part of an already existing group (e.g. 74xx or 40xx) there is nothing to be changed.
- Adjust the function "Logic_Gate". This function does most of
the work and is used by every symbol in the library. There are two sections to this function.
- The first section, starting with "if ( Lib_L_Sect == "PWR" )" is for drawing the Power/Ground symbol for each symbol. Most of the logic parts only require a single power pin (VCC) and a single ground pin (GND). Only if there are more than two power and ground connections, or you want the standard power and ground connections connections to says something other then VCC/GND, should anything need to be added.
- The second section starts at the end of the PWR section. It contains a "if" statement for each symbol in the library. Each of these "if" statements then contain multiple "if" statements, to decipher the specifications in the drawing command. In many cases, the "if" statement can contain several device names. This happens when the the same logic symbol is used for multiple devices. If the new symbol matches an symbol that already exists just add the symbol name to the "if" statement and your done with this file.
- Logic_Samples.js - This file is responsible for drawing the test symbol. All of the selections from Logic.html are passed to this file to draw the symbol. This file must decode the selections and and pass them on to the symbol drawing file, Logic.js.
- Logic.html - This is the file you are now reading. The reason it exists is to provide a test area for all the available symbols. Every available symbol can be selected and viewed. And, all of the available symbol options can be applied.
| Printing |
As soon as someone sees my drawings they immediately use their right mouse button to extract the image. But these are not images. They are dynamic Javascript drawings. If you try to simply print, none of the drawings will come out well. However, getting a copy of any of my drawing for printing is possible. It just takes a little bit of work.
To effectively make a print of one of the schematics, you need to use a graphics program that is capable of doing a screen clip. Actually, you don't really want the whole screen, just one of the windows. The graphic program that I use is Irfanview. The program is free and runs on almost any PC that you might have. Below is method that I use to create printable JPG images of my schematics. The items on the right of each step, in parenthesis, is the single stroke shortcut, if one exists.
Clicking on the thumbnail images will open a full size image in a new browser tab.
- Start Irfanviw. Irfanview should open up with a blank screen.
-
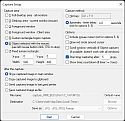 From the main menu select Options -> Capture/Screenshot.. (C)
This should bring up the Capture Setup screen where I have:
From the main menu select Options -> Capture/Screenshot.. (C)
This should bring up the Capture Setup screen where I have:- Capture area: 6) Object selected with the mouse,
- After the capture: Show captured image in main window,
- Capture method: Automatic, Timer delay 4.0 seconds, and
- Options: Stop timer after 5 shots.
Then click on START. The Irfanview windows should go away allowing you to select the window you want to capture using your left mouse button. The mouse arrow will not be included in the capture. -
 Clip the needed image section. This operation can be a little
complex. I suggest you try selecting and cropping on a throw away image, to understand how to use it.
Capturing a window usually captures more than you actually want. So you need to use Irfanview's Edit function to create a selection area and then crop the selection out of the image.
Clip the needed image section. This operation can be a little
complex. I suggest you try selecting and cropping on a throw away image, to understand how to use it.
Capturing a window usually captures more than you actually want. So you need to use Irfanview's Edit function to create a selection area and then crop the selection out of the image. - From the main menu select Image -> Replace Color
This is to remove the green background color (RGB 198, 247, 189; Hex C6F7BD). Read the hints on how to easily select the color.
- From the main menu select Image -> Convert to Grey Scale (Ctrl-G)
- Save the image to a file.

